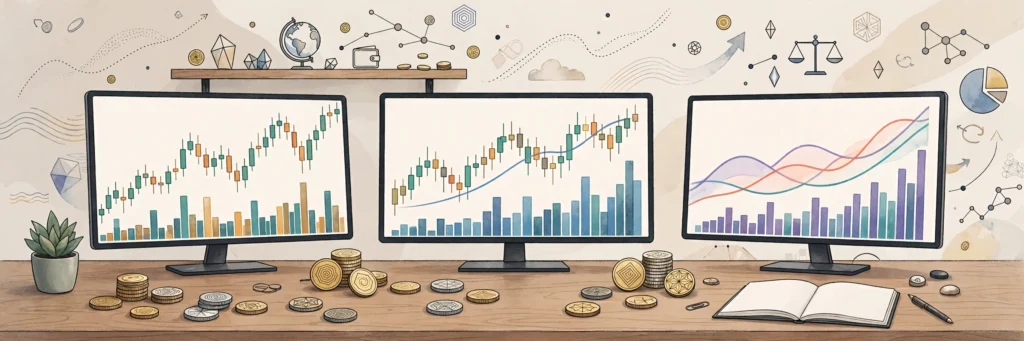
How to Read Crypto Markets: Price, Volume, Flows & Sentiment
Why Reading the Market Is a Skill, Not a Prediction
Crypto markets rarely move for one reason alone. A chart shows what happened, but not why traders acted, how much conviction sat behind the move, or whether the mood was calm, nervous, or overheated. Learning to read crypto markets means combining several kinds of evidence, then resisting the urge to turn that evidence into a confident forecast. This guide explains four building blocks: price, volume, exchange-traded fund flows, and sentiment, plus a simple routine and common mistakes to avoid. This is educational information, not financial advice, and not a recommendation to buy or sell any asset. Prices move, sometimes sharply, and past patterns do not guarantee future results.
Price: Start With Trend, Range, and Context
Price is the most visible part of a market, and the easiest to misread. A single day of gains or losses says very little alone. A better first question is whether the market is trending, ranging, or changing direction. In a rising trend, prices tend to make higher highs and higher lows. In a falling trend, the pattern reverses. In a range, prices move sideways between an upper area where selling has repeatedly appeared and a lower area where buying has repeatedly appeared. None of these patterns lasts forever.
Context matters as much as direction. A move that looks large on a one-hour chart may look small on a weekly chart. When those views disagree, the honest conclusion is often that the picture is mixed.
It also helps to separate price levels from price predictions. A level is an area where buyers or sellers acted before, such as a previous high, a previous low, or a round number that attracted attention. Levels are reference points, not walls, and prices break through them regularly. Bitcoin held above eighty-one thousand after a Federal Reserve hold in late October, in a dated snapshot. Those figures are dated snapshots, not current prices, and they show how a market can spend days near a similar area while the news changes. Measuring moves in percentage terms, rather than only in dollars, also helps keep volatility in proportion.
Volume: The Conviction Check Behind a Price Move
Volume measures how much of an asset changed hands during a period. It does not say whether a move will continue, but it can show whether many participants were involved or only a few. As a general guide, a price move with rising volume suggests broader participation, while a move on low volume suggests thinner participation. That distinction is useful, but it is not a rule that always holds, and volume should never be read alone.
If prices rise steadily while volume also rises, buyers were active across the move, rather than a small number of trades pushing the price. If prices rise while volume falls, the move can still continue, but fewer new buyers may be joining, and it may be more fragile.
Volume also helps at important levels. A break above a previous high on strong volume may carry more weight than the same break on weak volume. Even then, breaks can fail. Compare volume with its recent average, rather than an absolute number, because activity varies by news cycle and market conditions. When volume spikes sharply, ask what triggered it, rather than assuming the spike itself is a signal.
ETF Flows: What Fund Flows Show, and What They Do Not
Exchange-traded funds that hold crypto, or track crypto prices, have become an important way to follow institutional demand. When investors put new money into such a fund, the fund generally needs to buy the underlying asset or related exposure, and when investors withdraw money, the opposite can happen. Daily flow figures therefore give a rough sense of whether fund investors, as a group, were adding or reducing exposure on a given day.
First, flows are only one channel among many. Crypto also trades on spot exchanges, derivatives exchanges, and over-the-counter desks, and fund flows do not capture all of that activity. A day of fund outflows does not mean every investor is selling, just as a day of inflows does not mean every investor is buying. Flows can also be lumpy, and they are often reported with a delay, so prices may already have moved by the time a reader sees them.
A more reliable approach is to look at flows over a week or a month, rather than reacting to a single day. Steady inflows can suggest sustained interest, while steady outflows can suggest sustained caution. Even a longer run is not a forecast: investors can change direction quickly, and their decisions may reflect rebalancing or risk management. Flows are most informative alongside price and volume, and a fund can attract inflows and still fall in value.
Sentiment: Reading the Mood Without Following the Crowd
Sentiment describes how market participants feel: optimistic, fearful, greedy, cautious, or indifferent. It appears in social media discussion, news headlines, search interest, funding rates, and survey-based indicators that try to summarise fear and greed. Sentiment influences behaviour: high optimism can encourage buying at higher prices, while high fear can encourage selling at lower prices. Yet sentiment is hard to use well, because it is noisy, easy to manipulate, and often most extreme at turning points.
A useful distinction is between sentiment and positioning. Sentiment is what people say or feel. Positioning is what they have actually done with their money, such as how much leverage they hold. A market can sound extremely bullish while many traders are already fully invested, leaving fewer new buyers to push prices higher. Extremes can persist for a long time, and a market can become more extreme before it turns.
Social media deserves special caution. Online discussion can amplify a small number of loud voices and can be shaped by marketing, rumours, or promotion. A trending topic does not prove many investors are acting. Use sentiment as a warning about risk, rather than as a trigger for action. Recent coverage of growing caution among family offices after a large October liquidation event, in which about nineteen billion dollars in positions were wiped out according to that report, shows how one shock can change the mood across investor types. That figure is a dated report, not a current condition.
Putting It Together: A Simple Daily Routine
Reading markets well is less about finding a secret indicator and more about building a consistent routine. Start with price: what is the trend on the daily and weekly charts, and is the market ranging or trending? Next, check volume: was the latest move supported by above-average participation, or was it thin? Then look at fund flows over the past week or two, not just the latest day. Finally, check sentiment as context: is the mood calm, nervous, or overheated, and does it match what price and volume show?
When the pieces agree, the picture is clearer, though still not certain. A rising trend, rising volume, steady inflows, and calm rather than euphoric sentiment may suggest a healthier advance than the same price rise on falling volume, outflows, and extreme optimism. When the pieces disagree, acknowledge the conflict. Position size, diversification, and the ability to withstand a sharp fall matter more than any single market call.
Common Mistakes to Avoid
Several mistakes appear again and again. First, reacting to a single data point, such as one day of fund outflows, as if it settled the outlook: markets are noisy, and single days often reverse. Second, confusing a price level with a prediction: a previous high or low is a reference point, not a promise that prices will stop or reverse there. Third, following social media momentum without checking volume, flows, or the broader trend. Fourth, using leverage to amplify a market reading that is, at best, an educated interpretation, since leverage can magnify losses and force a sale at the worst moment. Fifth, ignoring the wider environment: interest-rate decisions, economic data, regulation, and traditional-market events can all affect crypto. A market wrap describing bitcoin holding near eighty thousand as a Federal Reserve week began, followed days later by coverage of bitcoin holding near eighty thousand seven hundred as the decision approached, shows how one macroeconomic event can frame several days of trading. Those snapshots are dated, and prices have moved since. Finally, do not treat a guide, chart, or indicator as a substitute for judgement: indicators summarise the past, they do not know the future, and they can conflict.
FAQ
What is the simplest way to start reading crypto markets?
Start with price and volume on daily and weekly charts. Identify whether the market is trending or ranging, compare volume with its recent average, and write down what you observe before checking news or social media.
Do ETF inflows mean prices will rise?
Not necessarily. Inflows show fund investors added exposure, but they are only one channel of demand, they can be lumpy, and they are often reported with a delay. Read flows over weeks alongside price and volume, not as a standalone buy signal.
Why does volume matter if price already shows the move?
Price shows what happened, while volume shows how much trading supported it. A move on strong volume suggests broader participation than the same move on thin volume, though neither guarantees continuation.
Can sentiment indicators predict market tops and bottoms?
Sentiment can highlight extremes, but it cannot reliably time reversals. Optimism can stay high for a long time, and fear can deepen before a recovery. Use sentiment as a risk warning, rather than as a trigger to buy or sell alone.
How often should I check market data?
For most readers, a daily or weekly routine is enough. Checking prices constantly can encourage impulsive decisions, especially in a volatile market. A short written note after each check helps track what changed and what remains unclear.
Source: Market context in this guide draws on dated y14.site market-wrap reports from late October, including coverage of bitcoin near the eighty-thousand-dollar area ahead of a Federal Reserve decision; figures cited are snapshots from those reports, not current prices.
—
Related reading on MM Crypto Analysis Web
- Crypto Market Close October 28: Breadth Turns Positive as Bitcoin Holds $81,254
- Crypto Market Wrap October 29: Bitcoin Holds Above $81,000 After Fed Hold
- Whales Turn Bearish on Bitcoin for First Time Since June as ETF Flows Stabilize
More in Markets on MM Crypto Analysis Web.

Pingback: Binance Security Breach Triggers Crypto Selloff