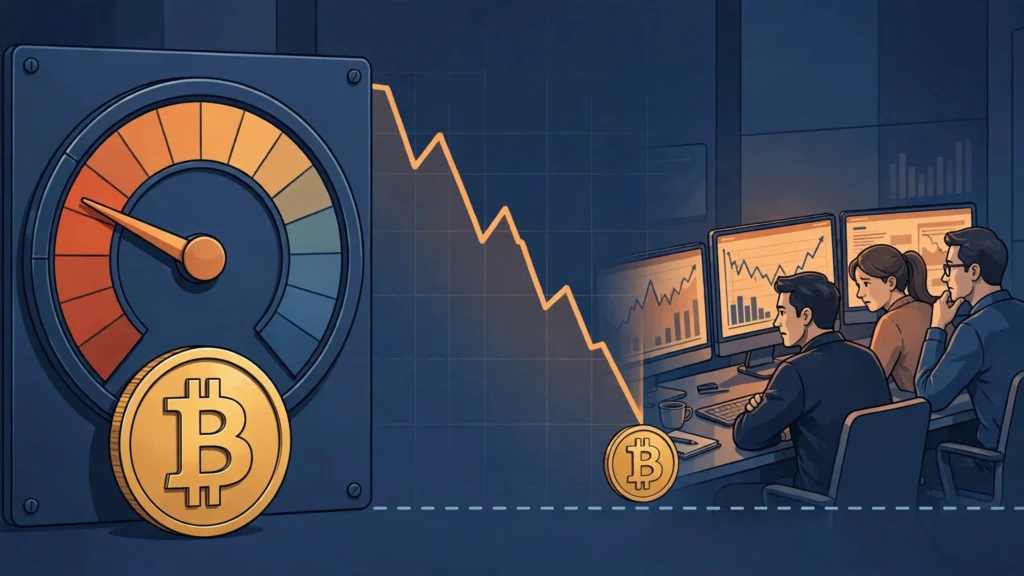
Bitcoin Fear and Greed Index Hits 28 as Market Tests the $69,000 Line
The Crypto Fear and Greed Index fell to 28 on Friday, November 6, down from 50 just days earlier, as a 6 to 8 percent drawdown pushed sentiment firmly into fear territory. Bitcoin was trading at $75,453, down 6.24 percent, roughly 30 percent below its cycle highs. The figures come from Crown Investing’s Friday Deep Dive, published on November 6, and describe a market tested hard in a week: a post-election rally erased in one session, over a billion dollars of leveraged positions liquidated, and roughly $1.8 billion in ETF outflows over two weeks.
A fear reading is often described as a contrarian signal, on the logic that markets bottom when pessimism is at its worst. There is some truth in that idea, but it is frequently overstated. A reading of 28 is fearful, but it is not extreme: truly extreme readings, in the single digits or low teens, have historically coincided with the most panicked moments in crypto history. A reading of 28 suggests traders are worried, not that they have capitulated, so the market may still fall further before sentiment reaches the extreme that has marked previous bottoms. The index measures mood, not a buying opportunity.
Bitcoin Fear and Greed Index: What a Reading of 28 Really Means
The Crypto Fear and Greed Index is a composite measure combining several signals into a single number from zero to 100: market volatility, trading volume, social media sentiment, surveys, Bitcoin dominance, and search trends. Zero represents extreme fear, 100 represents extreme greed, and around 50 is neutral. The fall from 50 to 28 in a matter of days tells us almost every component deteriorated at once: volatility rose, social sentiment turned negative, and Bitcoin fell relative to its recent history.
It is worth explaining why the index is so closely watched, and why it should not be followed blindly. Traders watch it because it captures the collective mood of millions of traders, expressed through their trading, posts and searches. But the index is also a lagging measure: it reflects what has already happened to prices, not what will happen next. A reading of 28 after a 6 to 8 percent drawdown is largely a description of the drawdown itself, not an independent prediction.
The most useful way to think about the reading of 28 is as a measure of how much pessimism is already priced in. At 50, the market was neutral; at 28, the bears have the upper hand and expectations have been reset lower. If the market receives genuinely good news from here, the reaction could be sharper than at a neutral reading, because fewer traders are positioned for a rally. That asymmetry is the real value of a fear reading: it does not tell you prices will rise, but it tells you the market is less vulnerable to disappointment than a week ago.
Bitcoin MVRV Ratio Near 1.4: Reading the On-Chain Signals
The MVRV ratio is one of the most widely followed on-chain indicators in Bitcoin, and it currently sits near 1.4, according to Glassnode data cited by Crown Investing. MVRV stands for Market Value to Realised Value. Market value is Bitcoin’s current price multiplied by the number of coins in circulation, the familiar market capitalisation. Realised value is more subtle: it values each coin at the price at which it last moved on the blockchain, a rough proxy for the price at which its current holder bought it. The ratio therefore measures, in aggregate, how much profit or loss the average holder is sitting on. A ratio of 1.4 means holders sit on a gain of about 40 percent on average, far below the ratios of 3 or 4 seen at previous bull-market peaks.
What does a ratio of 1.4 tell us? First, the market is not in the euphoric territory of cycle tops: at previous peaks, the MVRV ratio rose far higher as new buyers piled in. Second, the market is not yet at the deeply depressed levels of previous bottoms, when the ratio fell close to or below 1.0 and the average holder sat on a loss. At 1.4, holders are still in profit on average, so there is still room for further selling if sentiment deteriorates. The ratio describes a market in the middle ground: no longer euphoric, not yet capitulated, with further downside still possible.
A second on-chain indicator adds to the picture. The SOPR, or Spent Output Profit Ratio, tracked by CryptoQuant, sits just below 1.0, at about 0.97. SOPR measures whether the coins being spent on a given day are being sold at a profit or a loss. Above 1.0 means selling at a profit on average; below 1.0 means at a loss. At 0.97, the average coin is changing hands at a small loss, a classic sign of a market under pressure, in which holders are selling into weakness rather than taking profits. The selling is therefore not purely leveraged traders being liquidated.
Bitcoin $69,000 Support: The Level That Changes Everything
If one number matters more than any other in the current market, it is $69,000. As Crown Investing put it, “The level that changes everything is $69,000 on BTC, the previous cycle’s all-time high.” That level is significant for reasons both technical and psychological. Technically, the previous cycle’s all-time high is one of the most important levels on any chart, representing the price at which the last cycle’s buyers finally broke even, and it often acts as support in the following cycle. Psychologically, it is a round, memorable number that traders watch and place orders around, making it self-fulfilling: because so many people watch it, their collective behaviour makes it matter more.
Bitcoin is trading at $75,453, about $6,400 above that level, and the analysis frames the opportunity between $70,000 and $75,000 as asymmetric, meaning the potential reward from buying in that zone is seen as larger than the potential risk. The case for it is that $69,000 has deep historical significance, the MVRV ratio near 1.4 shows the market is no longer euphoric, and long-term holders are accumulating. The case against it is that the level is untested, ETF outflows are still heavy, and a break below $69,000 would signal the market structure has changed. If $69,000 breaks, the next levels down are much less clearly defined.
The honest way to describe the $69,000 level is as a line in the sand, not a guarantee. Support levels are not walls; they are zones where buyers have stepped in before, and they hold only as long as buyers keep stepping in. Its status as the previous cycle’s all-time high makes it a natural place for buyers to defend, but not invulnerable. Traders should watch how the market behaves as it approaches that level: a sharp bounce with rising volume would suggest buyers are defending it, while a slow drift through it would suggest the opposite.
Cold Wallets, ETF Outflows and a Market Pulled in Two Directions
One of the most interesting tensions in the current market is the contrast between long-term holders and ETF investors. According to Nansen data cited by Crown Investing, smart-money labels show accumulation of Bitcoin and Ethereum into cold wallets over the past 10 days. Cold wallets are offline storage, the crypto equivalent of a safe, and moving coins into them generally signals a long-term hold rather than trading. Accumulation into cold wallets therefore suggests some of the most patient participants are using the current weakness to buy, or at least to take their coins off exchanges.
That contrasts sharply with the ETF channel, where roughly $1.8 billion in net outflows has left combined products over two weeks, including $430.2 million from Bitcoin ETFs on November 5 alone. The two trends describe different groups behaving in opposite ways: long-term holders accumulating quietly, and institutional investors selling through the most visible channel in the market. The ETF channel is dominated by advisers and funds reacting to headlines, while cold-wallet accumulation is driven by holders with a much longer horizon. When those two groups disagree, the market tends to chop sideways.
The other indicators fill out that picture. DeFi total value locked has contracted about 14 percent over the past month, from about $115 billion to about $99 billion, showing the correction has reached decentralised finance. Bitcoin dominance stands at about 58.5 percent and has ground higher through the correction, meaning capital is sitting in Bitcoin or leaving, rather than rotating into altcoins. Ethereum, at $2,223 and down 8.16 percent, has underperformed Bitcoin, and its ratio against Bitcoin keeps deteriorating, which the analysis calls a “narrative vacuum” with no catalyst until the next major upgrade cycle. Solana, at $89.49, has held its relative structure but lost the $100 level, and HYPE, at $77.40 and down 7.17 percent, has fallen with the rest of the market. Perpetual funding rates on Binance and Bybit have flipped slightly negative, at about negative 0.005 percent per eight hours, a sign bearish sentiment has taken hold in derivatives. Dune Analytics shows decentralised exchange volume above $12 billion daily even as centralised exchange volume has dropped 25 percent.
FAQ
What is the Fear and Greed Index reading?
The index stood at 28 on November 6, down from 50, in fear territory after the market’s 6 to 8 percent drawdown.
What is the MVRV ratio and what does 1.4 mean?
MVRV compares market value with realised value, a proxy for the price holders bought at. At about 1.4, the average holder sits on a roughly 40 percent gain, well below previous peaks.
Why is $69,000 so important for Bitcoin?
It is the previous cycle’s all-time high, described by Crown Investing as “the level that changes everything,” with the $70,000 to $75,000 zone framed as an asymmetric opportunity.
What does a SOPR of 0.97 mean?
SOPR measures whether coins being sold change hands at a profit or a loss. At about 0.97, the average coin sells at a small loss, a sign of pressure.
Are long-term holders buying or selling?
Nansen data shows smart-money accumulation of Bitcoin and Ethereum into cold wallets over the past 10 days, even as ETF investors withdrew about $1.8 billion over two weeks.
Source: Crown Investing
Related reading on MM Crypto Analysis Web
- Why Bitcoin’s $76,000 Level Is the Line Traders Are Watching
- Bitcoin November Outlook: Stuck in a Chop Zone Between $75,000 and $90,000
- Bitcoin in 2026 So Far: Down, Drawn Down, Still Fighting Back
More in Bitcoin on MM Crypto Analysis Web.

Pingback: Zcash NU7 Goes Live: $15M in Sprout Funds Locked Away